Debug Panel
psp-js ships a built-in debug panel for inspecting a running game. Open it in-game with the Debug ▸ button; it slides in from the side and pushes the canvas aside. It refreshes live while open and costs nothing while closed.
The in-game bar
Above the canvas, a always-on bar shows:
- FPS, measured frame rate.
- Frame, the displayed-frame counter.
- TID, the currently running thread id.
- PC, the CPU program counter.
- Pause / Step, pause the emulator, then step exactly one frame at a time.
Panel sections
The panel stacks one section per subsystem. Each refreshes on its own cadence while the panel is open.
Performance
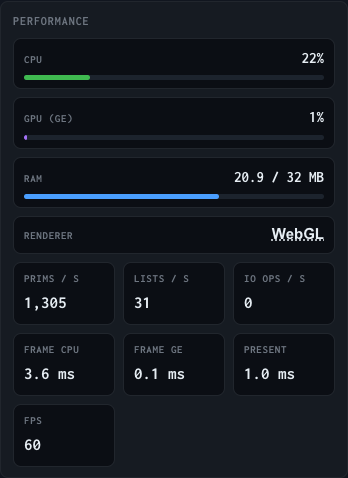
CPU, GPU (GE), and RAM usage bars, the live Renderer (which doubles as a click-to-switch toggle, see below), and prims / lists / IO per second. With the profiler on it also shows per-frame timing tiles: Frame CPU, Frame GE, Present, and FPS.
GE draw stats
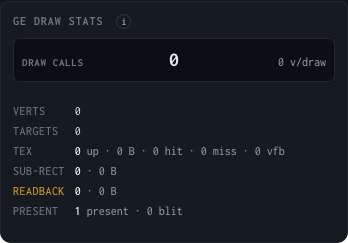
Per-frame WebGL counters: draw calls, vertices, render-target switches, readbacks, and present. Useful for spotting a draw-call-heavy frame. Populated when the profiler is on.
Threads
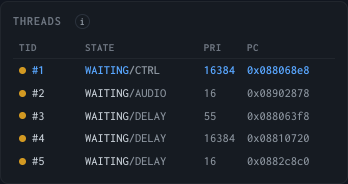
A table of every kernel thread: id, state (running, ready, waiting, dormant, dead), priority, and what a waiting thread is blocked on.
Memory
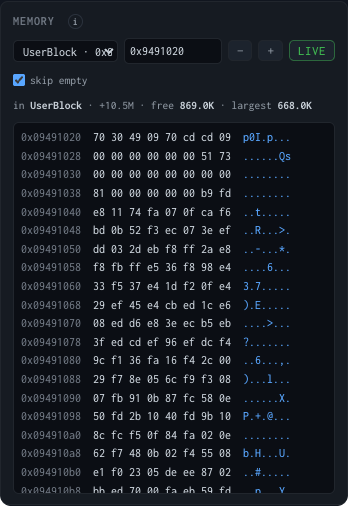
A hex viewer over RAM, VRAM, and scratchpad, refreshed a few times a second.
GE
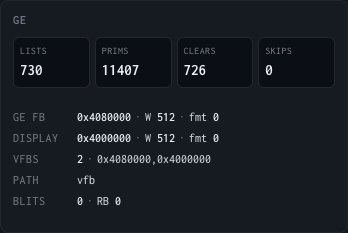
The GE display-list queue and recent command activity.
Save Data
A read-only list of the game's saves. Loading and deleting happen through the game's own save menu. See Saves.
Save State

Export and import whole-machine .pspstate snapshots.
Stubs Called
A histogram of the unimplemented syscalls the game has called, by call count. Handy for spotting what a non-working game depends on.
Logs
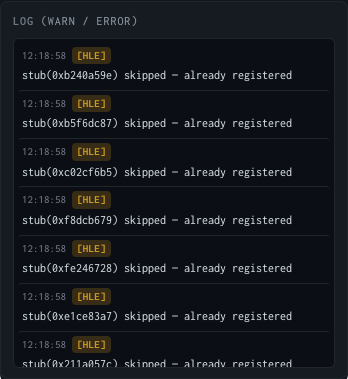
Live logger output captured while the game runs.
Switching renderer live
The Renderer value in the Performance section reflects what is actually drawing (read from the live GE state, not the boot dropdown). Click it to switch WebGL ↔ Software without rebooting. See Settings.
Console helpers
For deeper poking, the browser console exposes a few globals while a game runs:
| Global | Purpose |
|---|---|
_dbgEmu | The live PSPEmulator instance (inspect hle, cpu, bus, …). |
_dbgPerf | Per-frame profiler: .start(), let it run, .report(from, to) for a CPU-vs-present-vs-idle breakdown. |
_dbgCpuProf | Interpreter profiler: .start(), then .report() for an instruction-mix and hot-PC summary. |
_dbgPauseAt(frame) | Auto-pause the play loop at a given displayed-frame count. |
URL parameters that help scripted/perf sessions:
?perf            # enable the per-frame profiler and auto-print a summary at the pause frame
?pauseAt=N       # auto-pause at displayed frame N
?iso=/game.iso   # autoload a served game (see Running Games)